Machine Learning Basics: Logistic Regression (Classification)
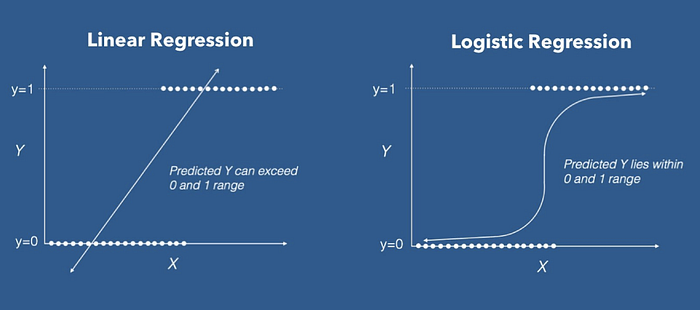
Logistic Regression is used to classify various objects. The final output of a logistic regression lies between 0 and 1 ie, 0 <= x <= 1
Thus, we can think this as a probabilistic of occurrence of an event.
Suppose, we have a picture of an animal and we want our model to classify which animal is in the picture. This is an example of classification.
Now let’s start.
Modules Required:
- sklearn
- pandas
- matplotlib
Import modules:
import pandas as pdfrom sklearn.model_selection import train_test_split
from sklearn.preprocessing import StandardScaler
from sklearn.linear_model import LogisticRegression
from sklearn.metrics import confusion_matrix, accuracy_scoreimport matplotlib.pyplot as plt
Data import and plot:
data = pd.read_csv('..\Datasets\heart.csv')
data.head()
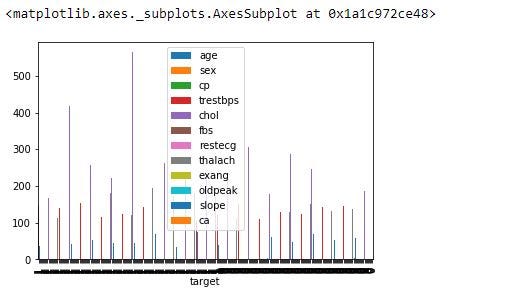
data.plot(x= 'target', y= data.columns[:-2], kind='bar')
We just plotted a bar graph to visually see our dataset.
Data extraction:
X_data = data.drop(['sex', 'target'], axis= 1)
Y_data = data['target']
We have dropped the columns ‘sex’ and ‘target’ because “target” is our Y_dataset column and we do not need the column ‘sex’.
Split the data into train & test part:
x_train, x_test, y_train, y_test = train_test_split(X_data, Y_data, test_size= 0.3, random_state = 0)Scaling out dataset:
We should scale our data, as the difference of highest value and lowest value is very large. Hence, we scale our data in a certain range by using an object of StandardScalar()
.fit_transform() scales our data to a distribution where mean value = 0 and standard deviation = 1
scalar = StandardScaler()
x_train_scaled = scalar.fit_transform(x_train)
x_test_scaled = scalar.fit_transform(x_test)print( x_train_scaled)

Model creation and training:
logistic_model = LogisticRegression()
logistic_model.fit(x_train_scaled, y_train)
Test the model (prediction) :
y_pred = logistic_model.predict(x_test_scaled)Finding accuracy:
The principal diagonal in a confusion matrix shows the number of data-points our model predicts correctly. Here it is 32 + 44 = 76
The Minor or Off diagonal in a confusion matrix shows the number of data-points our model predicts incorrectly. Here it is 12 + 3= 15
The sum of all ie 76 + 15 = 91: should be equal to the length of out test dataset
cm = confusion_matrix(y_test, y_pred)
print( cm )
print( accuracy_score(y_test, y_pred) )
FULL IMPLEMENTATION IS GIVEN BELOW:
# import modulesimport pandas as pdfrom sklearn.model_selection import train_test_split
from sklearn.preprocessing import StandardScaler
from sklearn.linear_model import LogisticRegression
from sklearn.metrics import confusion_matrix, accuracy_scoreimport matplotlib.pyplot as plt# import datasetdata = pd.read_csv('..\Datasets\heart.csv')
data.head()# plot the bar graph of datasetdata.plot(x= 'target', y= data.columns[:-2], kind='bar')# data extraction from datasetX_data = data.drop(['sex', 'target'], axis= 1)
Y_data = data['target']# train_test_split of sub-datasetsx_train, x_test, y_train, y_test = train_test_split(X_data, Y_data, test_size= 0.3, random_state = 0)# making an object of standard scalar to scale our datasscalar = StandardScaler()
x_train_scaled = scalar.fit_transform(x_train)
x_test_scaled = scalar.fit_transform(x_test)# model creation and traininglogistic_model = LogisticRegression()
logistic_model.fit(x_train_scaled, y_train)# model testing (prediction)y_pred = logistic_model.predict(x_test_scaled)# Finding accuracy using confusion matrix and accuracy scorecm = confusion_matrix(y_test, y_pred)
print( cm )acc = accuracy_score(y_test, y_pred)
print( acc )
Conclusion:
We have seen, how to classify observations using LogisticRegression(). In this example, we have seen classifying only two classes. But we can distinguish between many classes by the same code if we have dataset describing them.
